Building reliable agents: observability & evals
Traces, failure taxonomies, and calibrated judges — how to know when a run broke and catch regressions before users do.
In the previous two posts, we made agents safer to ship:
- Governed gateways: model/tool calls are controlled, observable, and swappable.
- The agent runtime: runs don't loop forever, blow budgets, or half-apply side effects.
This post is about making agents reliable under change.
The truth is that the agent that worked yesterday will regress. You'll tweak a prompt, add a tool, switch a model, adjust retrieval… and the system will quietly get worse. You won't notice until users complain. And when they do, you won't be able to reproduce the failure.
Part 3 is about closing that gap with two capabilities:
- Observability: a trustworthy record of what happened.
- Evals: a disciplined way to decide whether it was good, and whether it's improving or regressing.
Reliability for agents is not a single number
For agents, reliability is a bundle of properties:
- Task success (did it accomplish the user goal?)
- Safety (no policy violations, leaks, or unsafe actions)
- Predictability (bounded cost, bounded tool calls, bounded latency)
- Recoverability (safe retries, resumable runs, no corrupted state)
- Explainability (you can debug a specific failure without guessing)
Without a robust observability and evals flow, you're not engineering these, you're hoping.
Observability starts with a unit of truth: the trace
A useful mental model (from OpenTelemetry/OTel) is:
- A trace is the full story of one end-to-end execution. In our case: one agent run.
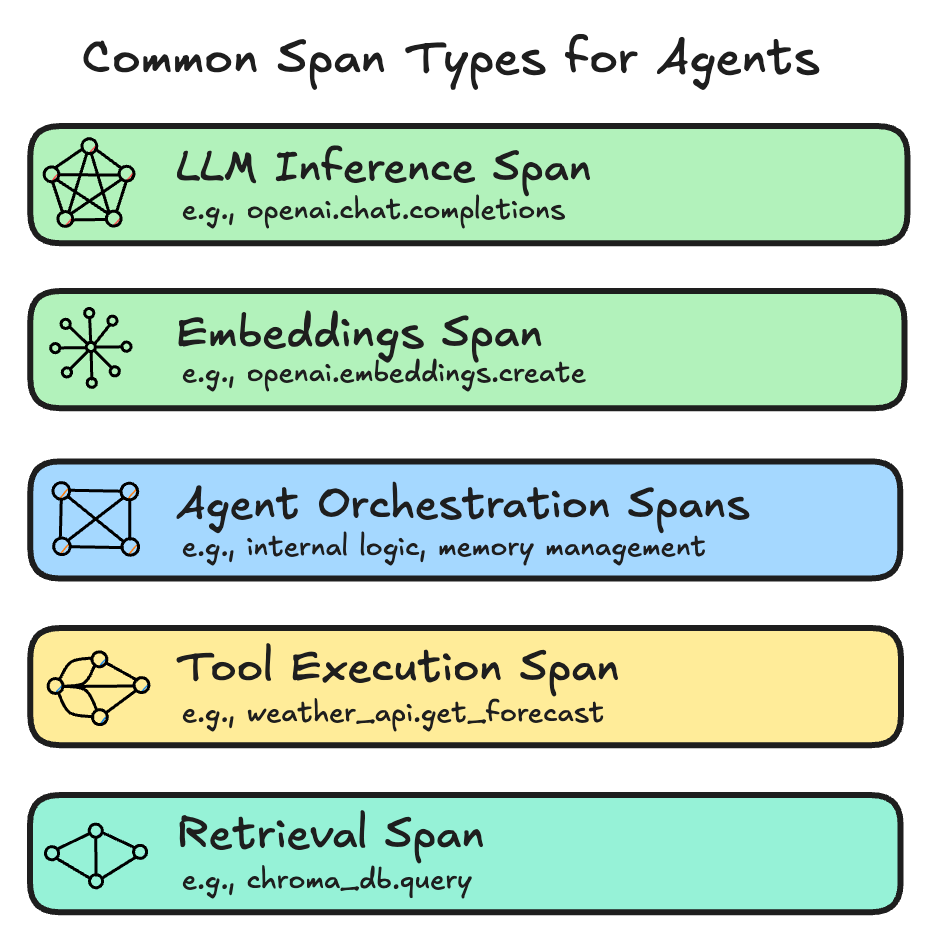
- A span is one timed operation inside that run: a model call, a retrieval query, a tool invocation, a safety check.
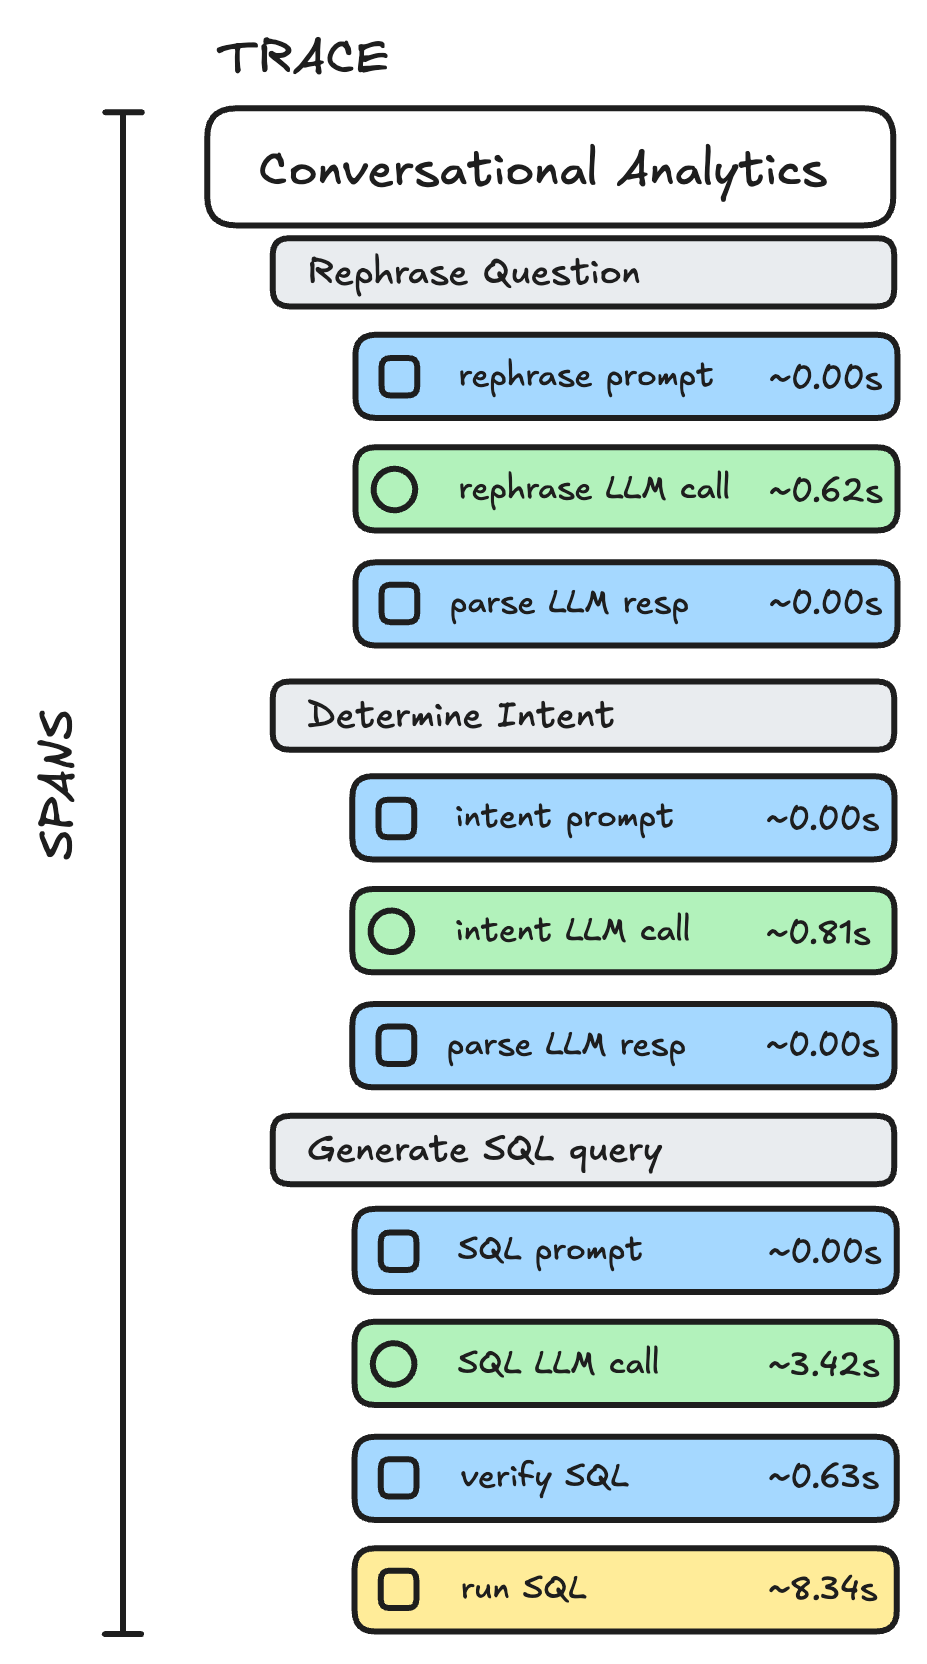
- Spans nest (parent → child), which creates the familiar waterfall view in trace UIs.
- Spans can include events (timestamped notes like "retry triggered") and attributes (structured metadata like
model=...,tool=...,tokens_out=...). - Links connect related traces when work branches, resumes, or becomes async (common with human-in-the-loop or long-running jobs).
When I say "the trace is the canonical record of a run," I mean: it stitches together a hierarchy of spans that lets you reconstruct what happened, not just what the agent said, but what it did, where it spent time, and where it failed.
One practical detail: most systems also have an application-level run_id. Treat run_id as a required attribute on the root span, so you can jump from a user report → run_id → the exact trace (trace_id) instantly.
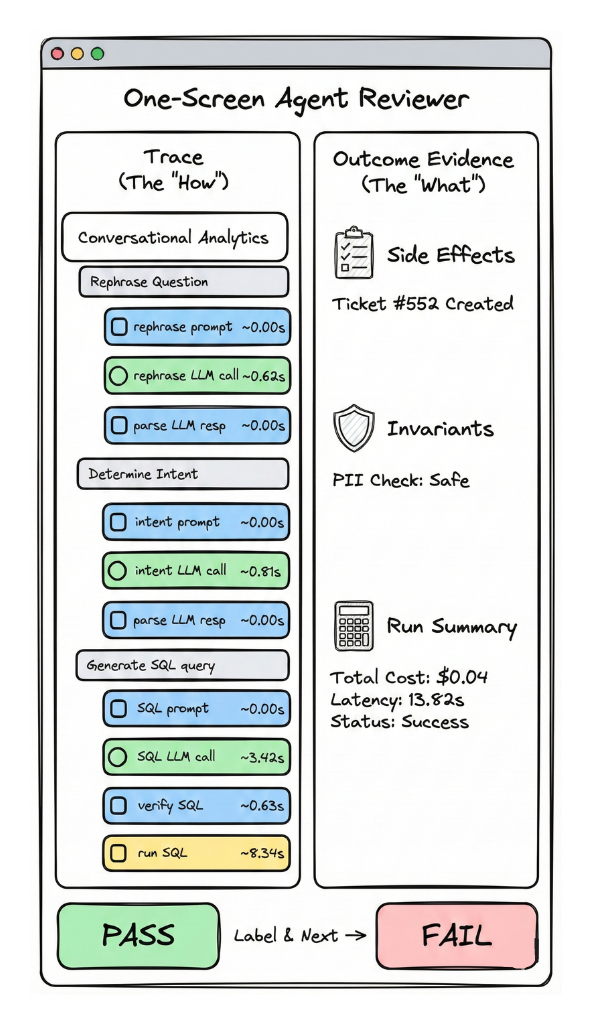
Here's how a typical agent trace looks like (for a conversational analytics agent):
For agent observability, the goal is to answer questions like:
- What was the run trying to do at each step?
- Which tools were called, in what order, with what inputs (or at least checksums/redacted views)?
- What did retrieval supply (and what did it miss)?
- What guardrails fired (and why)?
- Where did cost/latency/tool-call count spike?
- What changed between "working" and "broken"?
Pattern 1: Trace-first runtime
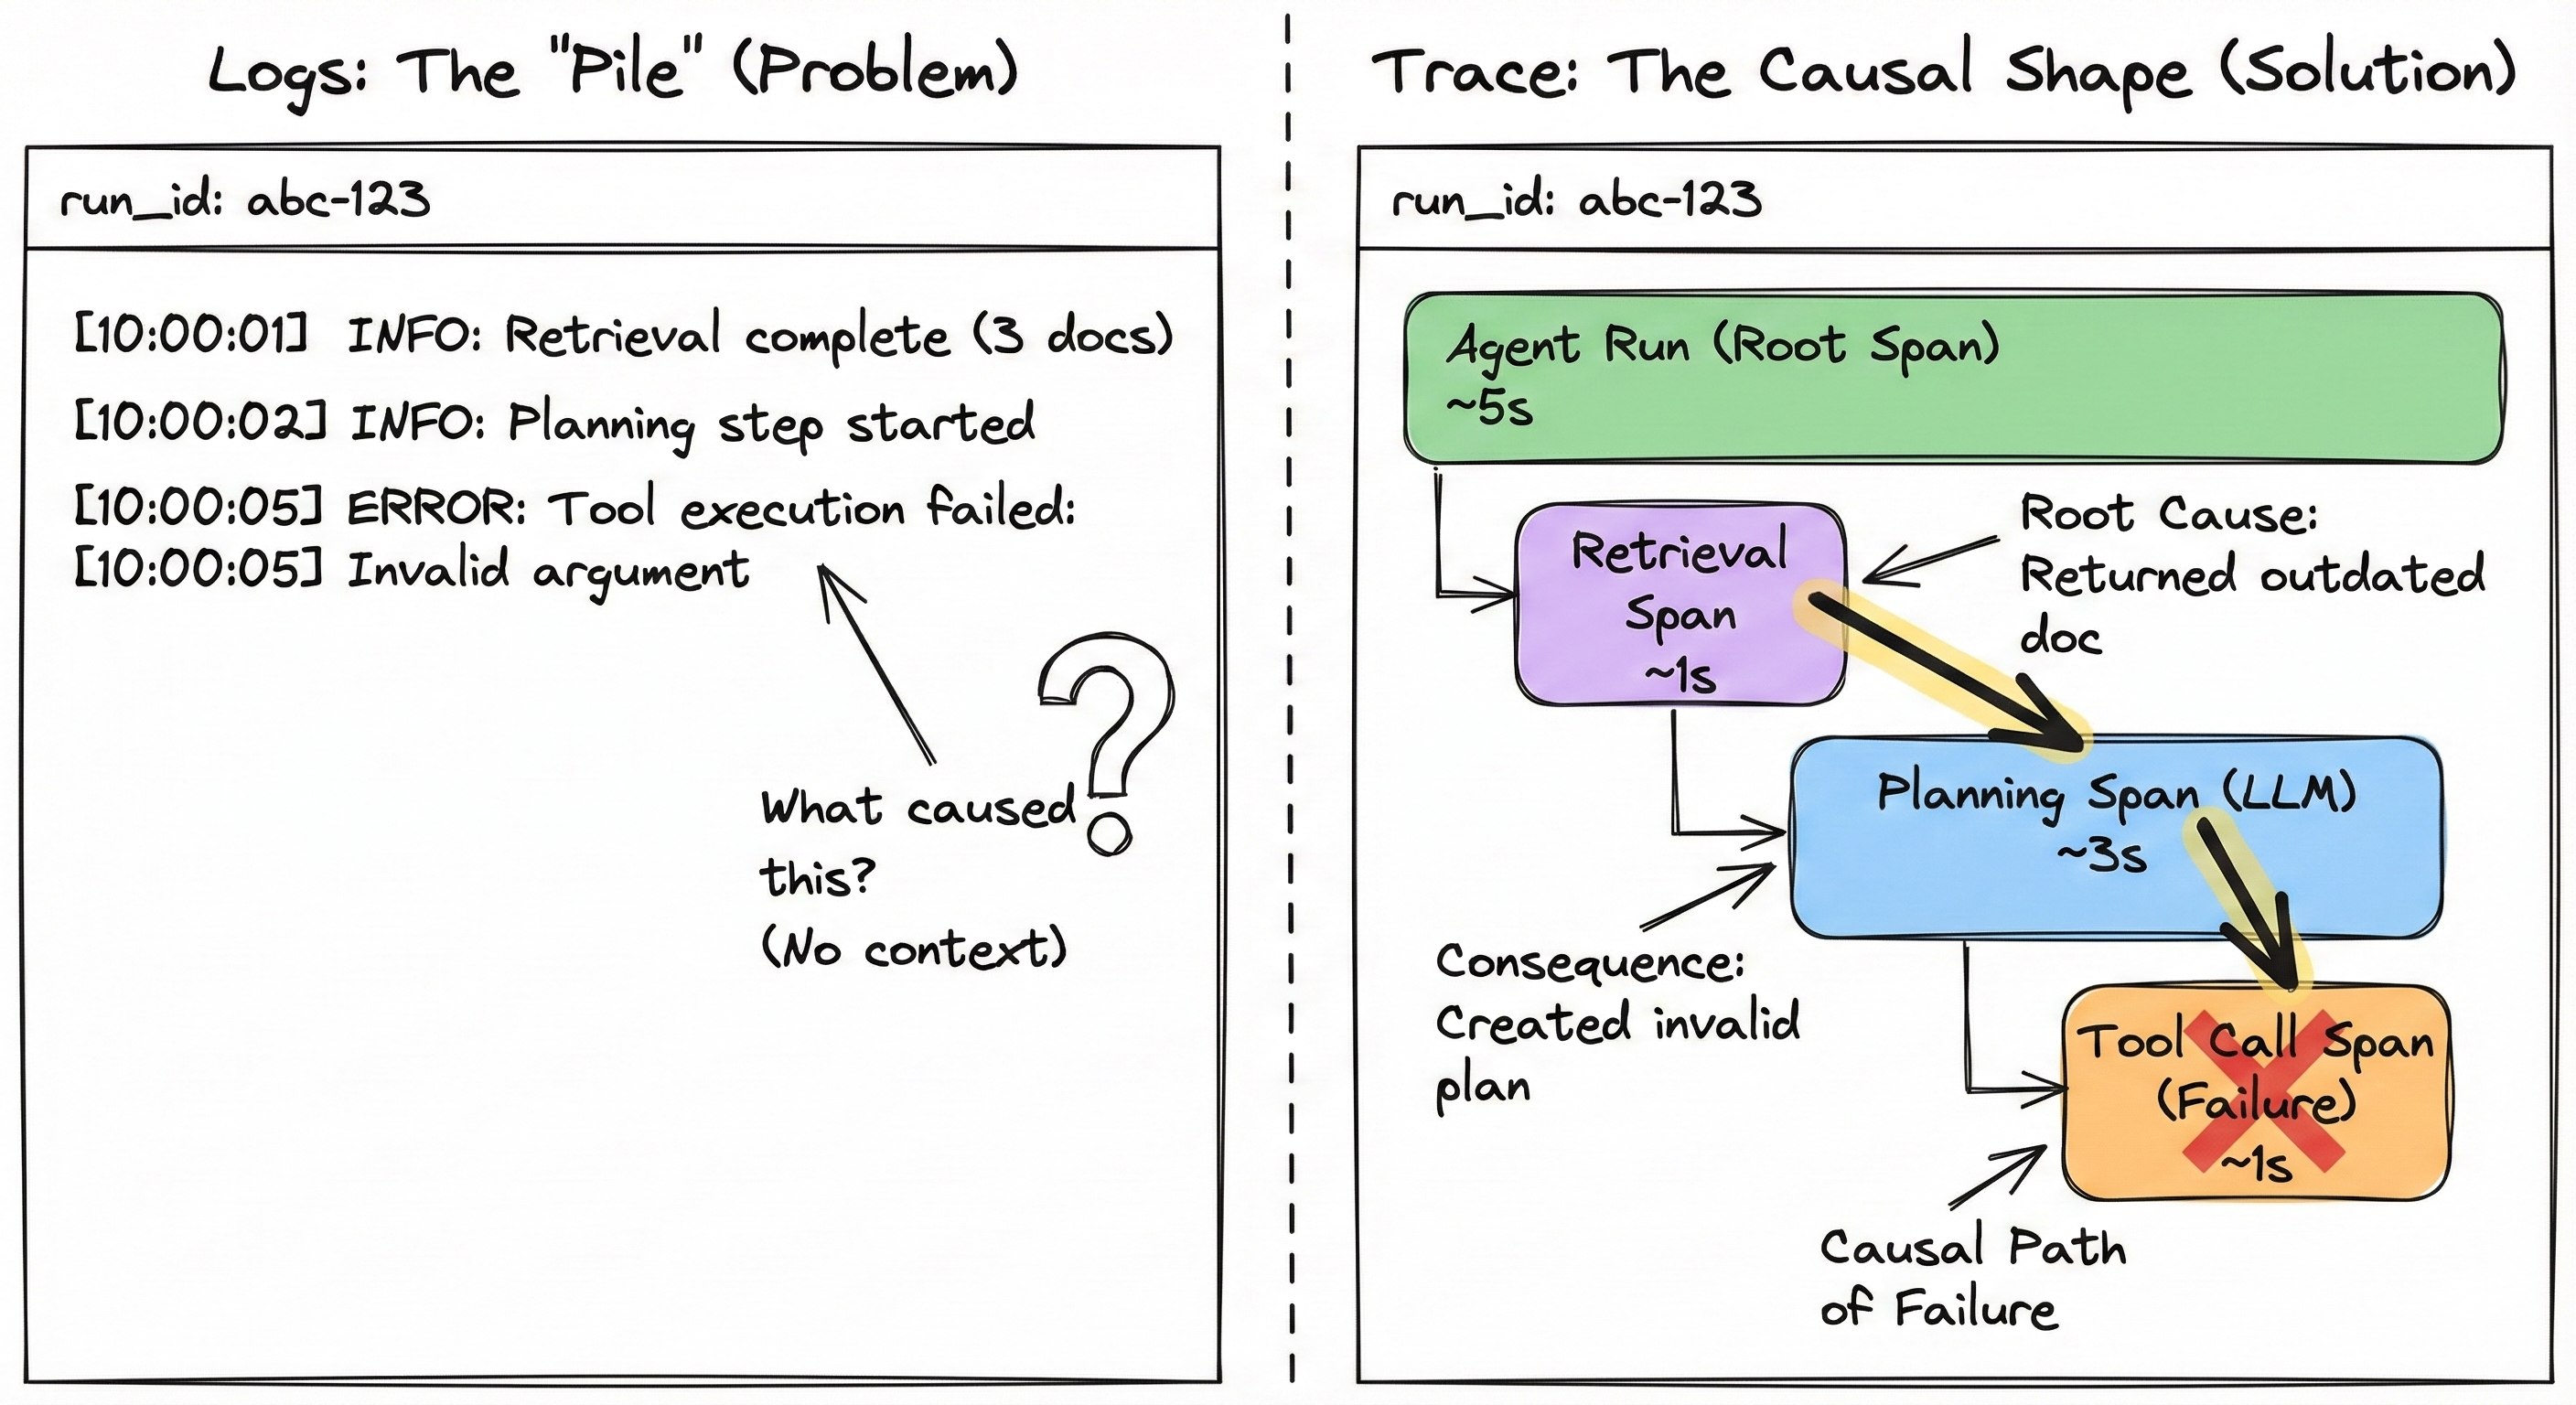
The problem: Logs don't explain multi-step failures. In agent systems, failures are often causal: one bad retrieval → wrong plan → wrong tool call → messy output. A pile of log lines won't tell you the shape of that cascade.
The approach: Make trace emission a non-optional runtime requirement: every run produces a trace composed of structured spans and events with stable identifiers, plus (when needed) pointers to redacted artifacts for replay/debug. "Stable" here means: you can always map a user report to a run_id, then to a trace_id, then to the exact spans where the run diverged.
Tradeoff: You must solve redaction, retention, and access control early. Otherwise teams either (a) log everything and create privacy risk, or (b) log nothing useful and call it "compliant."
In practice: Prefer open standards (e.g., OTel GenAI semantic conventions). Conventions standardize span types and attribute keys (e.g., consistent fields for model identity and token usage), making telemetry queryable and comparable across agents, teams, and tools. Agent platform teams can also implement central redaction/retention in the OTel Collector, reducing privacy risk and instrumentation drift.
Pattern 2: The schema contract
The problem: Fragmentation breaks platform leverage. If Team A calls it token_usage and Team B calls it gen_ai.tokens, you cannot build a shared dashboard, a shared cost analyzer, or, most importantly, shared evaluators. You end up maintaining N versions of the same evaluation logic.
The approach: Enforce a "Minimum Viable Schema" as a strict contract. The contract defines the mandatory root-level metadata and the expected span structure for common operations (LLM calls, tool usage). This allows you to write an evaluator (e.g., "Check for PII in tool outputs") once and run it across every agent in the company.
Tradeoff: Development friction. Engineers hate looking up naming conventions. You will need to provide SDK wrappers or linters to make compliance the path of least resistance.
Using the OTel mental model above (trace/span/attributes/events/links), here is the detailed contract that makes debugging and evals scalable:
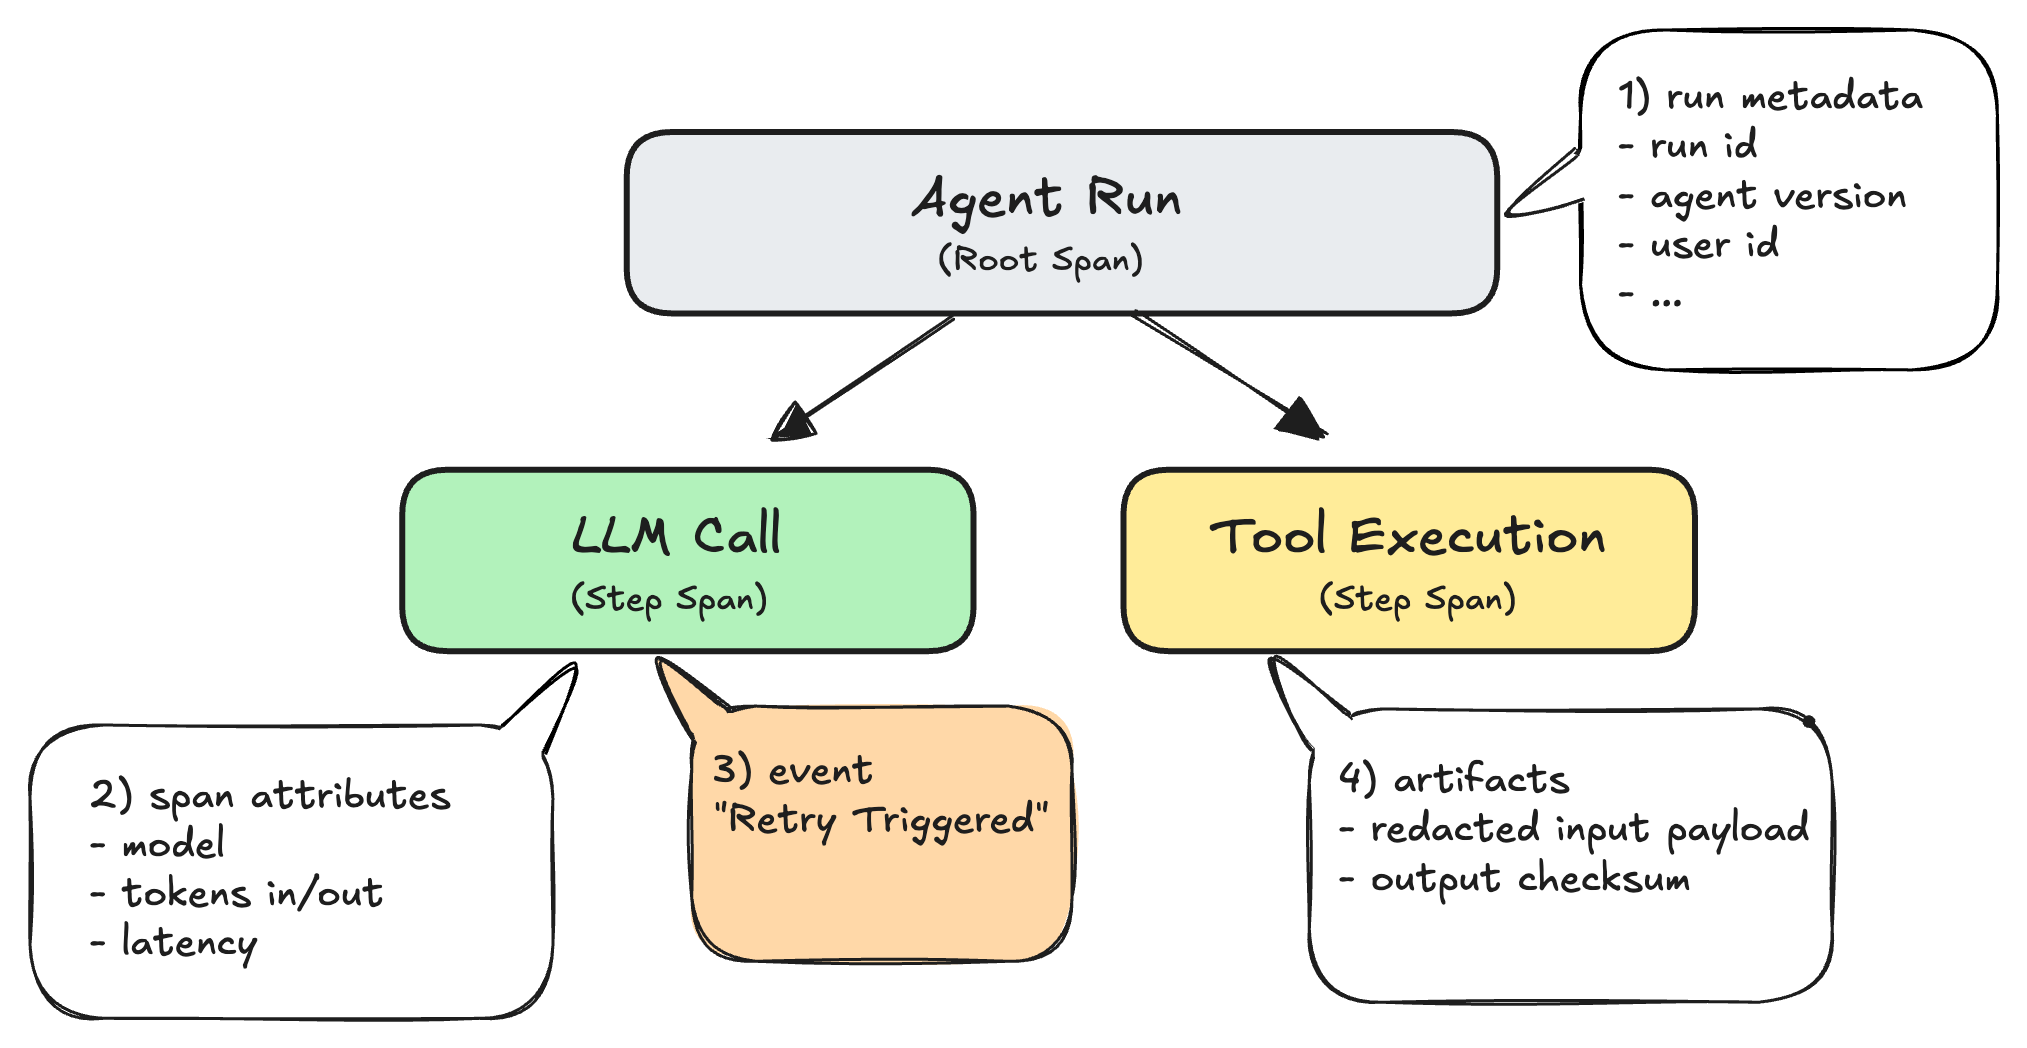
1) Run metadata (provenance)
Attach necessary metadata to the root span (e.g., agent.run) so every run is attributable and reproducible:
- agent name + version
- prompt/config hash; tool schema version; retrieval config version
- model selection policy + chosen model
- budgets (token / cost / latency / tool-call caps)
- privacy-safe tenant/app identifiers; environment (dev|stage|prod)
- feature flags / experiment arm / rollout version
2) Step spans (the causal chain)
Represent each meaningful step as a child span under the run. The key is not "more spans". It's a consistent span taxonomy so everyone debugs the same shape.
- LLM inference spans: model name, tokens in/out, latency, finish reason.
- Retrieval spans: query hash, corpus/index, top_k, retrieved doc IDs.
- Tool spans: tool name, latency, status/error type, request/response checksums.
- Safety spans: policy name/version, decision (allow/deny).
3) Events (state transitions)
Use events when the span is still "the same operation," but its internal state changes: retries, fallbacks, throttling, or human approval requests.
4) Artifacts (what you may need for replay/debug)
Artifacts are the pieces you may need to investigate or replay without guessing, stored with redaction and access controls:
- prompt template ID + resolved prompt hash
- tool payloads/outputs (redacted)
- retrieved doc IDs/snippets
- evaluation context (dataset id)
Platform builder note: your strongest leverage is making this schema a contract. Teams can build different UIs and workflows, but the underlying trace + span taxonomy + required attributes must be consistent, otherwise cross-agent querying breaks and shared evaluators don't compose.
Evals sit downstream of traces. In practice, an evaluation is just a structured judgment over a run: you take the trace (spans, attributes, events, and redacted artifacts) and compute a verdict: pass/fail, scores, or tagged failure modes. If your trace schema is inconsistent, your evals will be inconsistent too: you won't be able to reliably locate the right step (retrieval vs tool vs model), compare runs across versions, or aggregate regressions across teams. That's why "trace-first" isn't only about debugging, it's the foundation that makes evaluations scalable, comparable, and automatable.
Observability isn't "dashboards." It's debug throughput
Most teams under-invest here. But debugging speed is the compounding advantage: the faster you can understand failures, the faster you can fix them, and the more often you'll actually run the loop.
Two practical principles from the field:
-
Keep all relevant context on one screen. Reviewers should be able to decide "did this run succeed?" and "why did it fail?" without jumping across tools. The trace is necessary, but often not sufficient. People also need the surrounding context that explains what "success" means in this domain.
-
Optimize for review speed, not visual polish. If your generic trace viewer makes it hard to filter, compare runs, or see outcomes quickly, build a lightweight internal review surface. Even a simple purpose-built view can dramatically increase throughput because it removes friction from the most repeated workflow: trace review.
Pattern 3: One-screen outcome review
The problem: Reviewers waste time correlating traces with business outcomes. In practice, the slowest part of debugging is often not reading the trace, it's figuring out whether the run "worked" in the real world.
The approach: Design the review surface around goal completion evidence alongside the trace. Examples:
- tool side-effects ("ticket created," "refund issued," "playlist updated")
- invariants ("no PII written to memory," "no policy violations")
- run-level summaries (final answer, chosen tools/models, total cost/latency, guardrails triggered)
The key idea is to show the trace and the outcome evidence together, so reviewers can label success/failure quickly and move on.
Tradeoff: Requires extra integration work (joining traces to downstream systems, defining domain-specific success signals, building a small UI or notebook view). But it pays back every day because it reduces the time spent on the most frequent activity in the eval loop: reviewing runs.
Evals begin with diagnosis, not automation
Once we have observability set up and traces coming, it is time to think about how to set up your evaluation workflows.
Pattern 4: Taxonomy-driven evaluation
The problem: Generic "quality" metrics (like "helpfulness") create false confidence and unclear action. You cannot fix "correctness", you can only fix specific failures like "retrieval misses."
The approach: Let failure modes emerge from your own data. Start with manual diagnosis to define your baseline taxonomy, then scale using automated clustering to discover unknown failure modes at scale.
Tradeoff: Manual review is high-effort but high-precision. Automated discovery is scalable but requires infrastructure investment to tune the clustering.
The workflow: diagnosis before automation
The biggest mistake teams make is jumping to "we need metrics" before they know what failures actually look like. The correct order is: collect traces → understand failures → write evals.
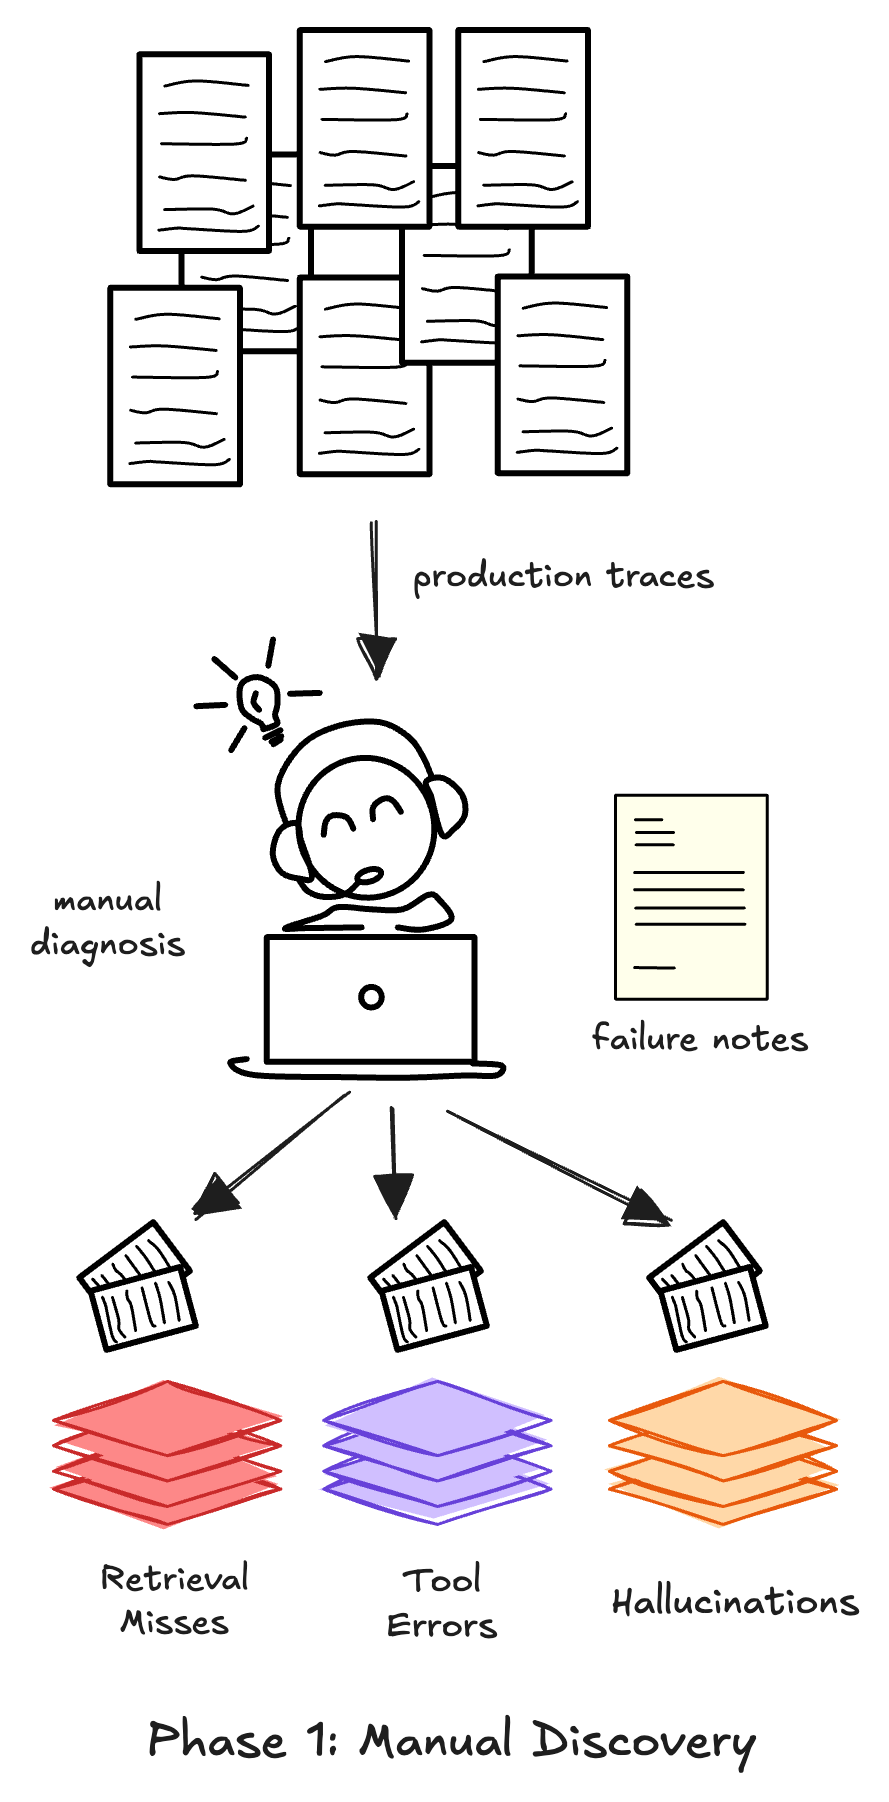
Phase 1: Manual diagnosis
Do this when you are launching or have low volume (less than 50 failing runs/day).
1) Sample real traces. Use production traces if you have them; otherwise, generate realistic synthetic interactions. Aim for variety, don't just test the happy path.
2) Write "failure notes". For each trace, record what felt wrong in human language.
Tip: Focus on the earliest upstream failure. Failures are often sequential — upstream failures cause downstream failures. For example, a bad retrieval often causes a bad LLM generation. Fix the root, not the symptom.
3) Group notes into a failure taxonomy. Cluster failures into 5–10 categories specific to your product. Count frequency to prioritize what to fix first.
4) Stop when you reach saturation. Stop when new traces stop teaching you new things.
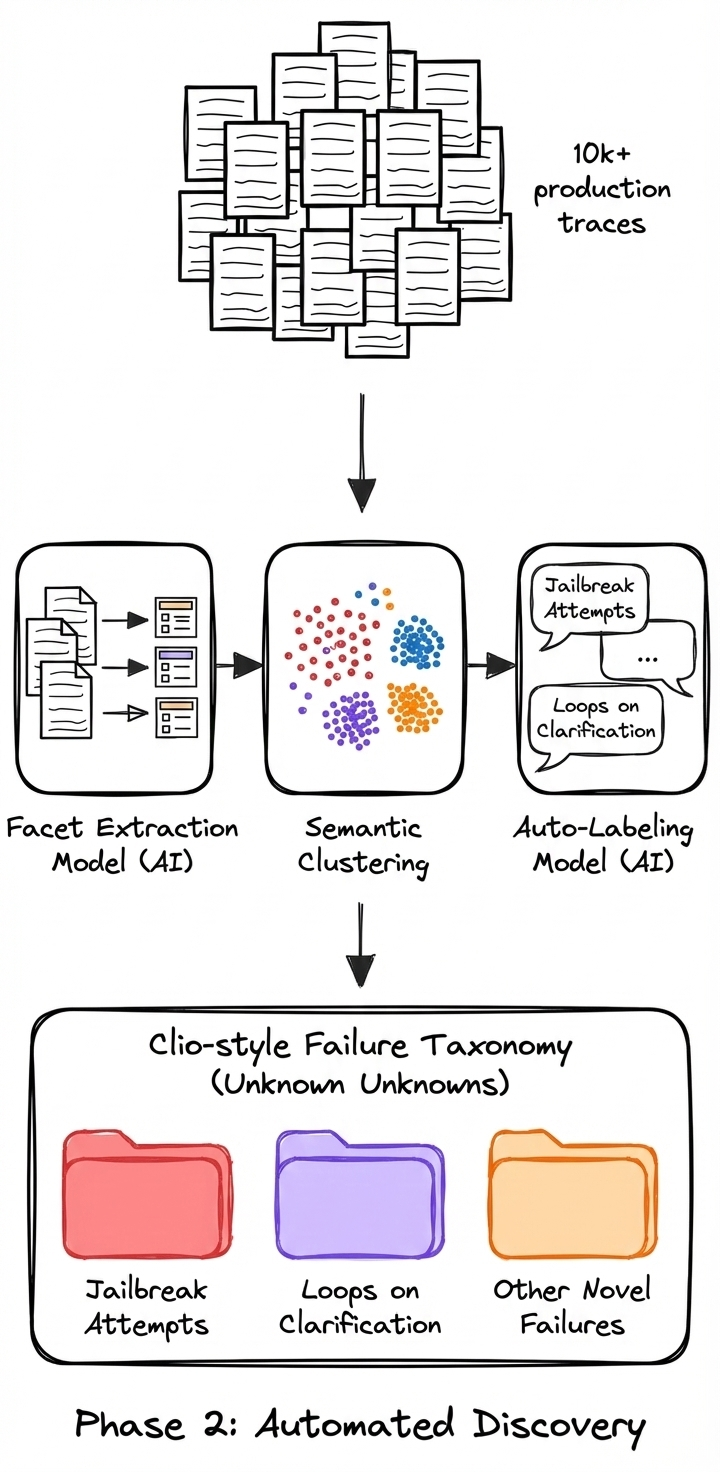
Phase 2: Automated discovery
Do this when you have high volume (10k+ runs) or need to find "unknown unknowns" that you missed manually.
Scale the discovery loop with a bottom-up clustering pipeline (inspired by Anthropic's Clio system for privacy-preserving pattern discovery in real-world assistant interactions). While Clio focuses on safety and privacy monitoring, the same architectural pattern works for quality:
-
Facet Extraction: Use a lightweight model to summarize traces. While Clio extracts generic facets (topic, length), you should adapt this to extract agent-specific facets like "User Goal," "Tool Outcome," or "Error Type."
-
Semantic Clustering: Embed these summaries and cluster them to find dense "blobs" of similar behavior.
-
Auto-Labeling: Use an LLM to propose descriptive failure modes for each cluster (e.g., "Jailbreak Attempts" or "Loops on Clarification").
This allows for bottom-up pattern discovery, letting the data suggest where the system is breaking without you defining the categories in advance.
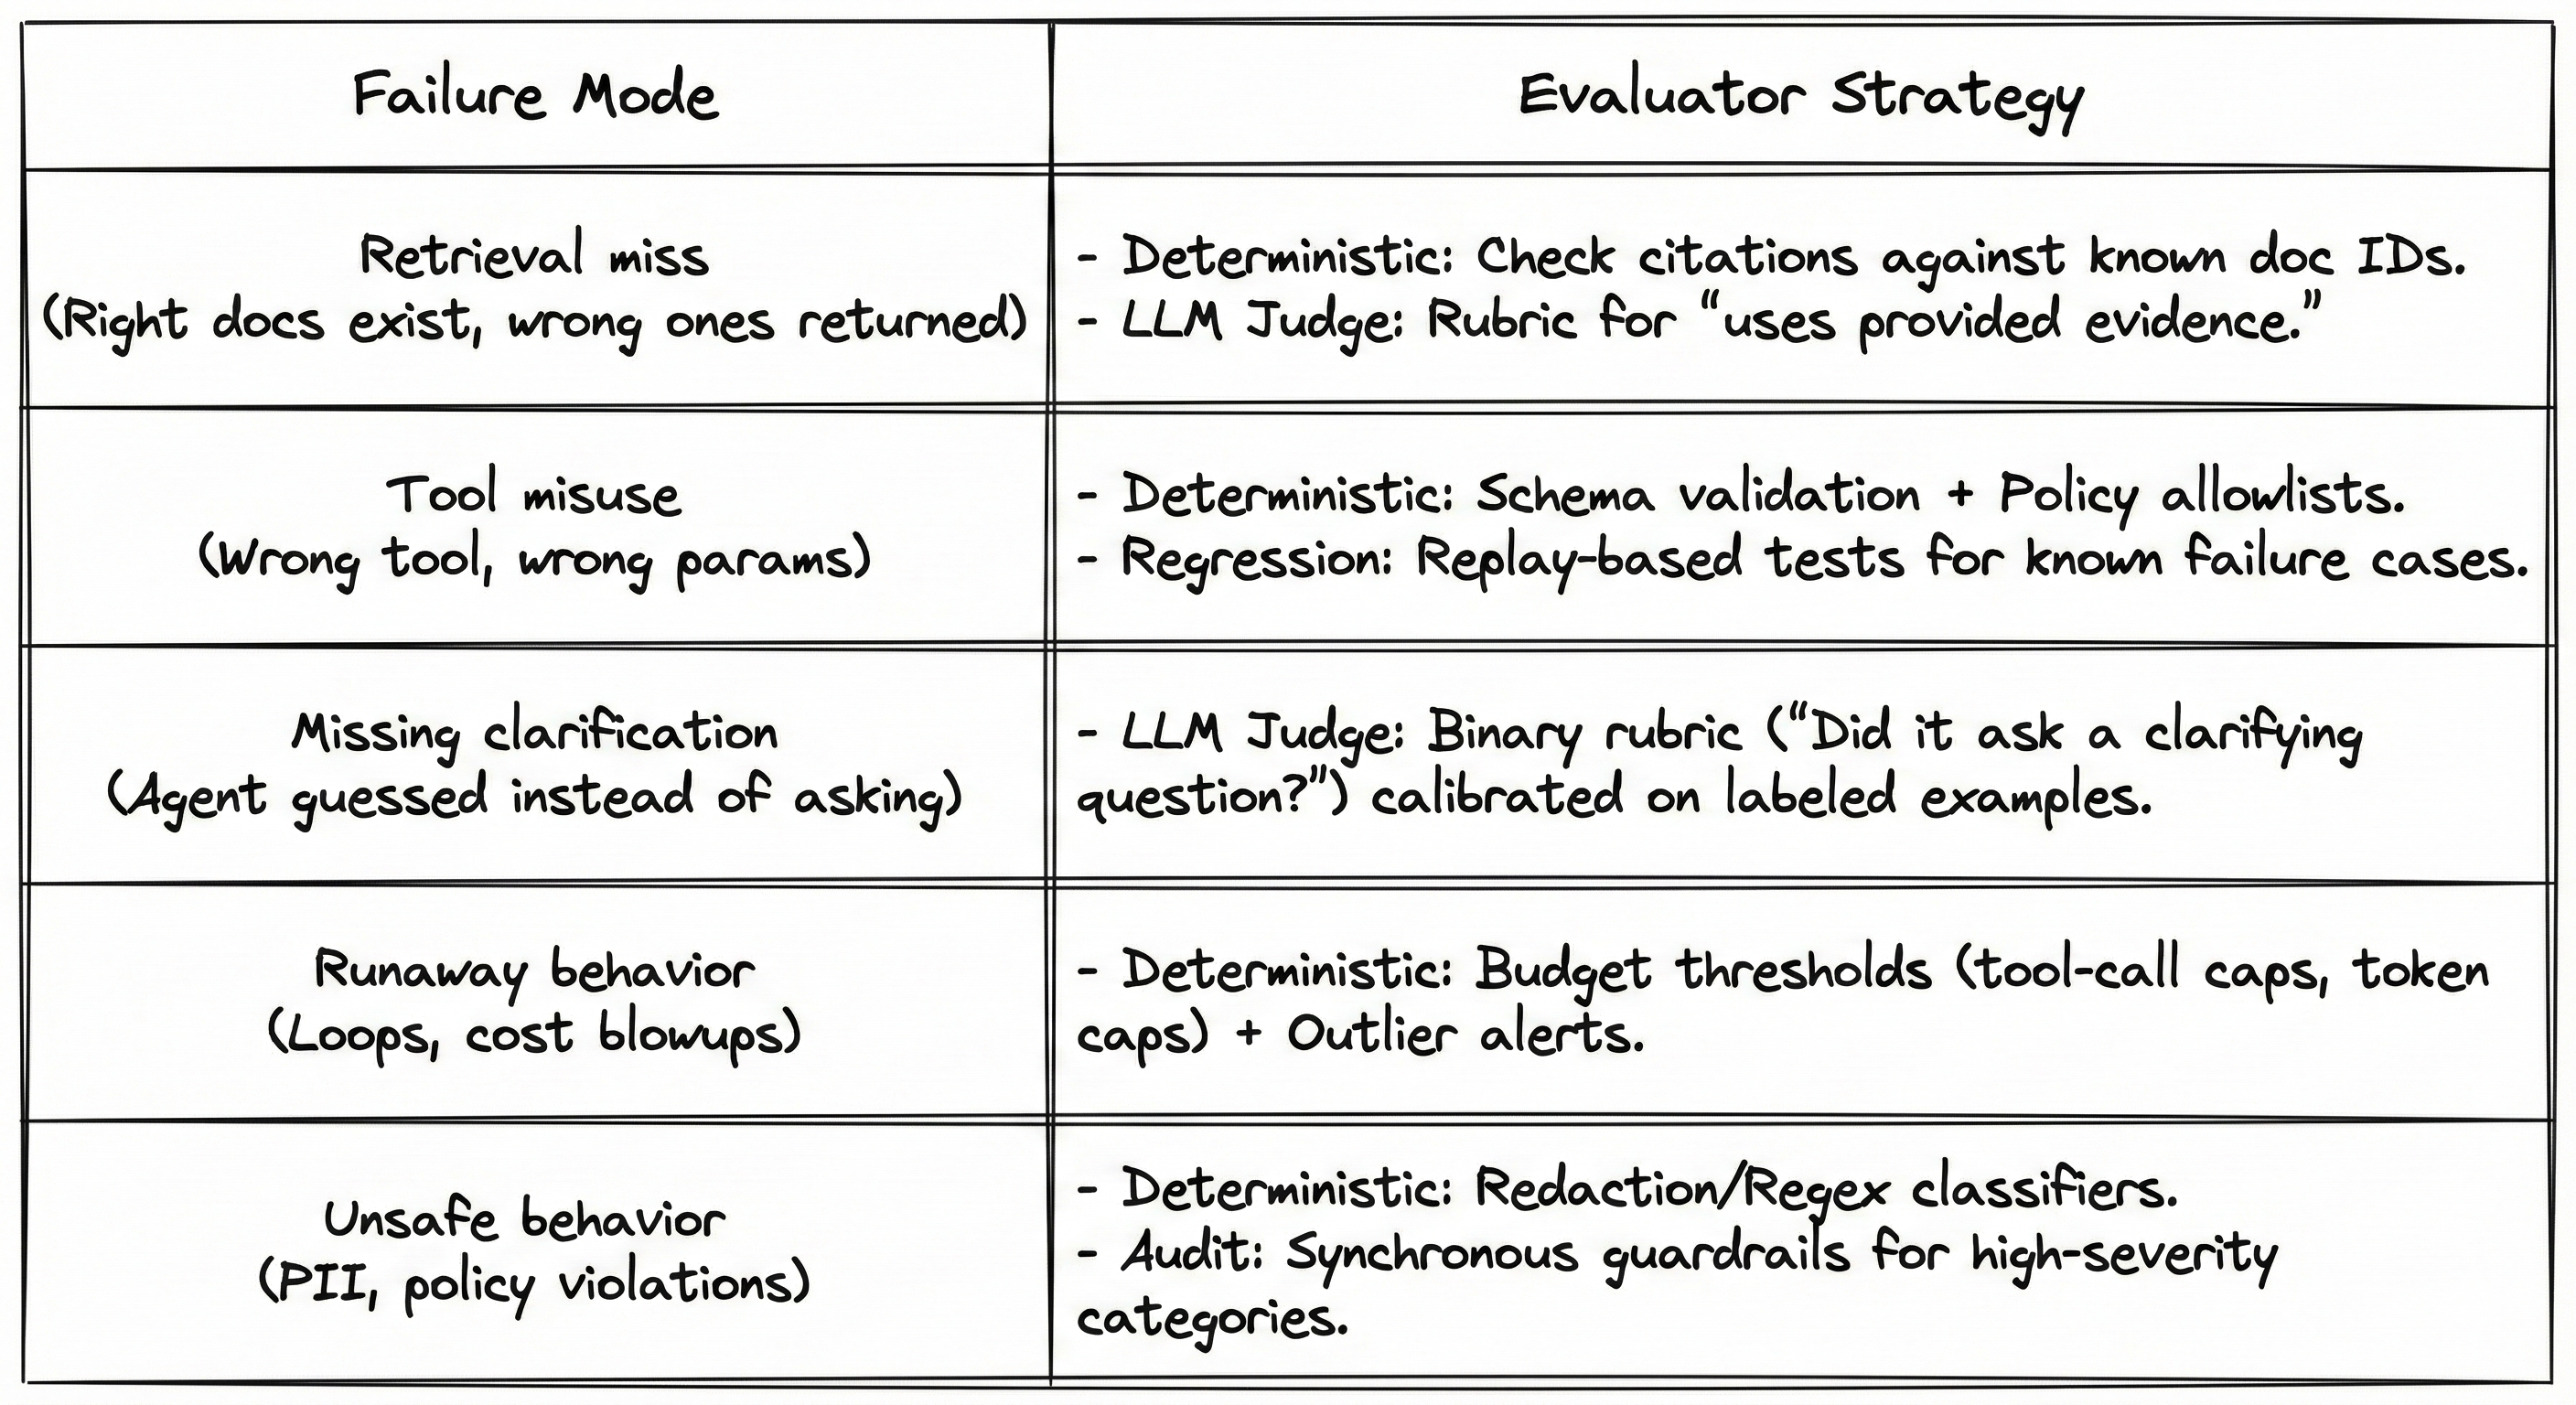
From taxonomy to evaluators (the mapping)
Whether you find them manually or via clustering, the goal is to pick your top 3 failure modes and attach the cheapest reliable evaluator to each.
The evaluator ladder: cheapest checks first
Once you have a taxonomy, you must decide what to automate. The core principle is: Use the cheapest evaluator that reliably detects the failure mode.
-
Level 1: Deterministic checks (fast, objective) — Use code-based evaluators for objective failures: invalid schema, missing fields, budget exceeded. These run constantly and provide immediate feedback.
-
Level 2: Human review (the gold standard) — Humans define "good" in your domain. Even if you automate later, human judgment is the anchor.
-
Level 3: LLM-as-judge (subjective, scalable) — Useful for nuanced behavior, but they are not magical truth engines. They are tools that must be calibrated.
Pattern 5: Multi-speed evaluation
The problem: Evals are either too slow to be used daily (human review) or too shallow to be trusted (simple assertions).
The approach: Split evaluators by cost/speed and run them at different frequencies.
Tradeoff: Requires discipline in how you promote evaluators between tiers.
The tiered approach
- Every commit: Fast deterministic checks (Level 1).
- Every PR / Nightly: Slower judge-based evals (Level 3) over a golden dataset.
- Production monitoring: Sampling + periodic deep dives (Level 2) to discover new failure modes.
Pattern 6: Judge calibration as a product risk
The problem: Uncalibrated judges produce noise (false alarms) or miss real failures, destroying trust in the signal.
The approach: Treat your judge like a classifier. Tune it against expert labels using TPR and TNR, not accuracy, and iterate on the prompt until those scores hit your risk threshold.
Tradeoff: Judge quality is never "done." You must revisit it as products evolve.
The "accuracy trap"
As Hamel Husain points out in A pragmatic guide to LLM evals for devs, accuracy is a dangerous metric for agents. If your system succeeds 95% of the time, a lazy judge that marks everything as "PASS" has 95% accuracy, but zero value.
Instead, track two specific metrics:
- True Positive Rate (TPR): What % of successful sessions did the judge correctly pass? (Do we trust the "Green" signal?)
- True Negative Rate (TNR): What % of failed sessions did the judge correctly catch? (Do we trust the "Red" signal?)
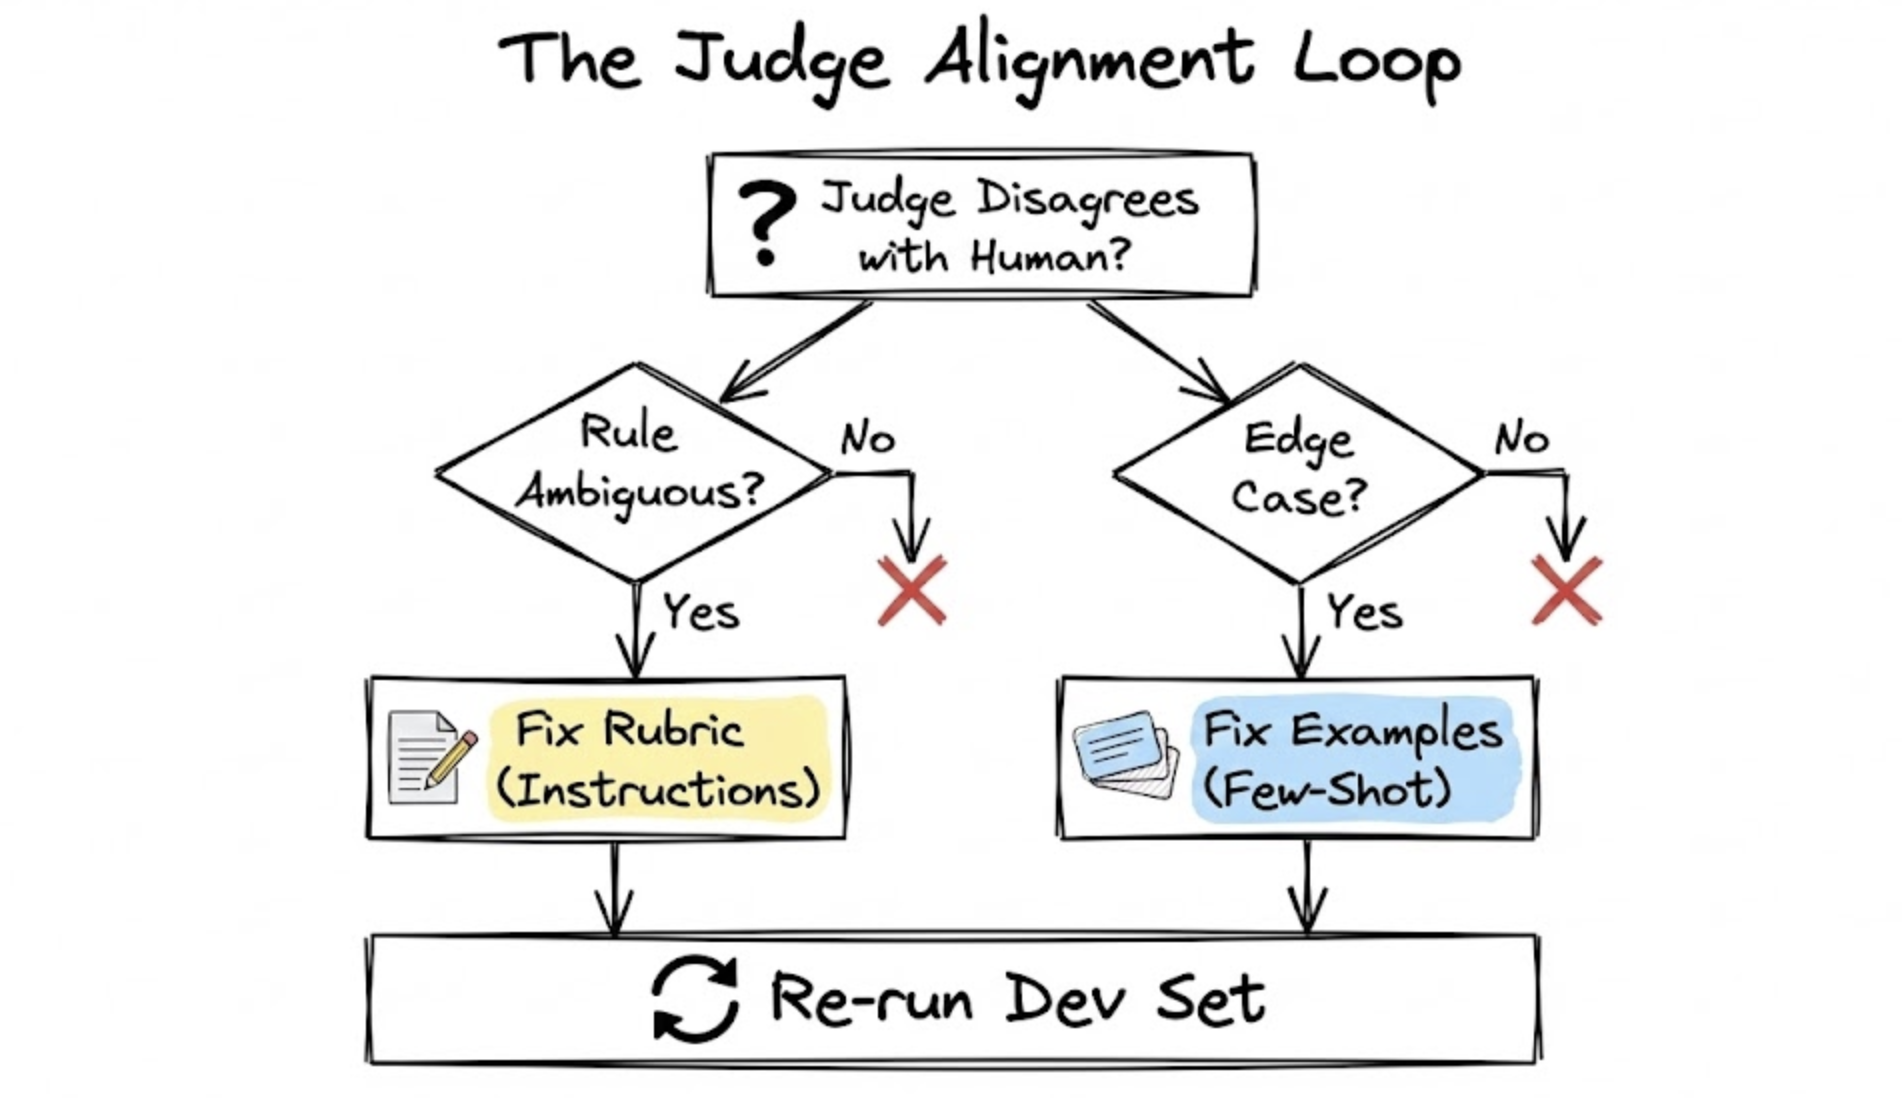
The alignment loop: rubric vs. examples
Creating a prompt is just a hypothesis. To fix a judge that disagrees with a human expert, categorize the failure:
-
Is the rule ambiguous? Symptom: The judge passed a trace where the user said "this is confusing," but your prompt didn't define "confusion" as a failure. Fix: Update the rubric. Make the instructions more precise.
-
Is it a nuanced edge case? Symptom: The judge failed a handoff that was clunky but ultimately correct. Fix: Update the examples. Add a similar "imperfect-but-passable" trace to the few-shot examples.
General principle: Use the prompt's instructions for clear, universal rules, and use few-shot examples to illustrate tricky edge cases.
Pattern 7: Internal annotation is a strategic asset
The problem: External annotation (outsourcing) is often fast but shallow and misaligned with product goals.
The approach: Keep core error analysis close to the product team. Only outsource mechanical tasks after you've defined the rubric internally.
Tradeoff: Requires focused time from domain experts, but that time is the foundation of real quality.
Humans in the loop principles
Early in a product's life, the fastest way to get consistent annotations is a single accountable quality owner. If you need multiple annotators:
- Label shared examples independently.
- Measure agreement (e.g., Cohen's Kappa).
- Align on disagreements until consistency is high.
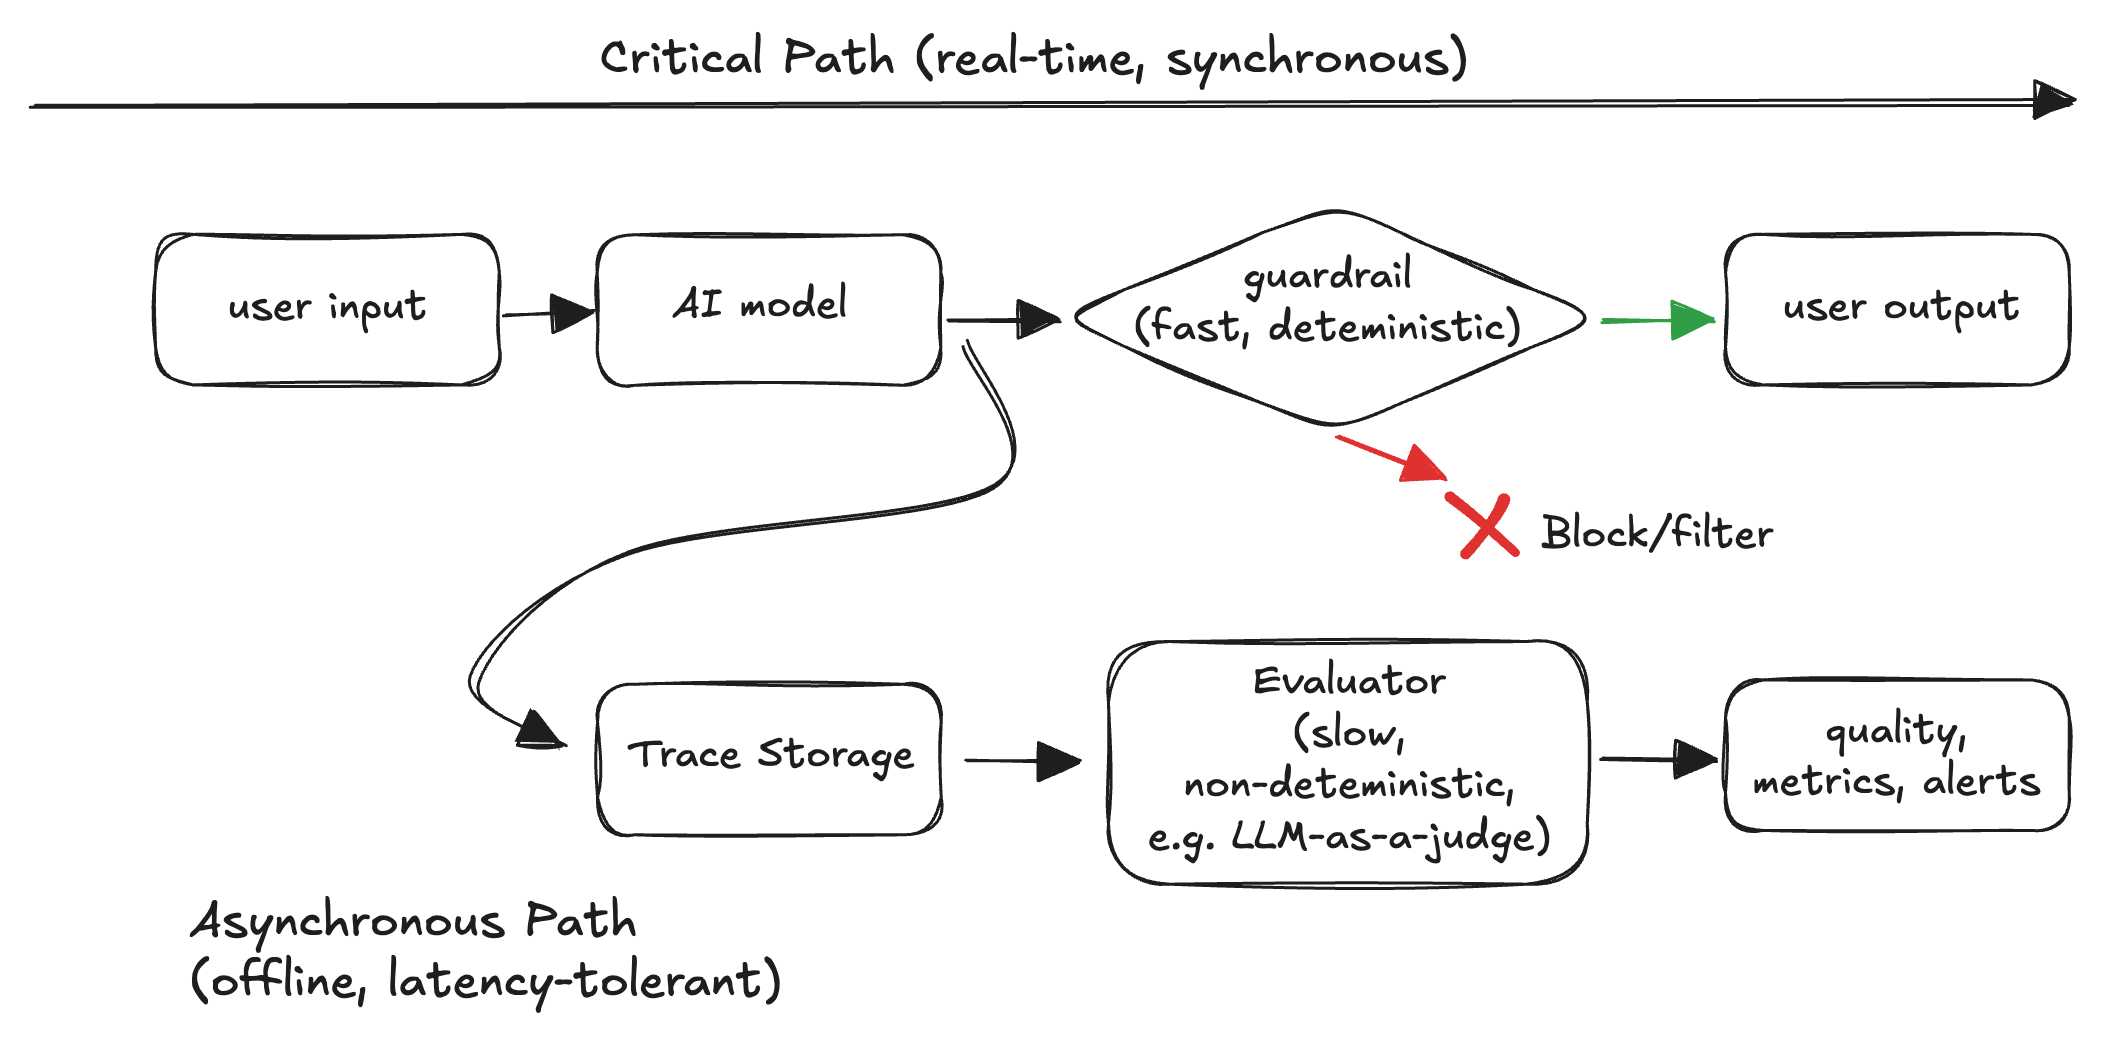
Guardrails vs evaluators: don't confuse them
One more distinction that matters operationally:
- Guardrails run in the critical path to prevent high-impact failures in real time.
- Evaluators can run asynchronously to measure quality and detect regressions.
Whether something belongs in the critical path depends on latency/cost and the false-positive vs false-negative tradeoff. In most systems, slow or non-deterministic LLM judges are a bad fit for synchronous blocking.
What "reliable" feels like
Reliable agents aren't agents that never fail. They are agents where:
- Failures are visible (traceable).
- Quality is measurable (taxonomy + evaluators).
- Regressions get caught early (tiered gating).
- Improvements compound (datasets and evaluators evolve with the product).
That's what observability + evals really buy you: not perfection but stability under change.